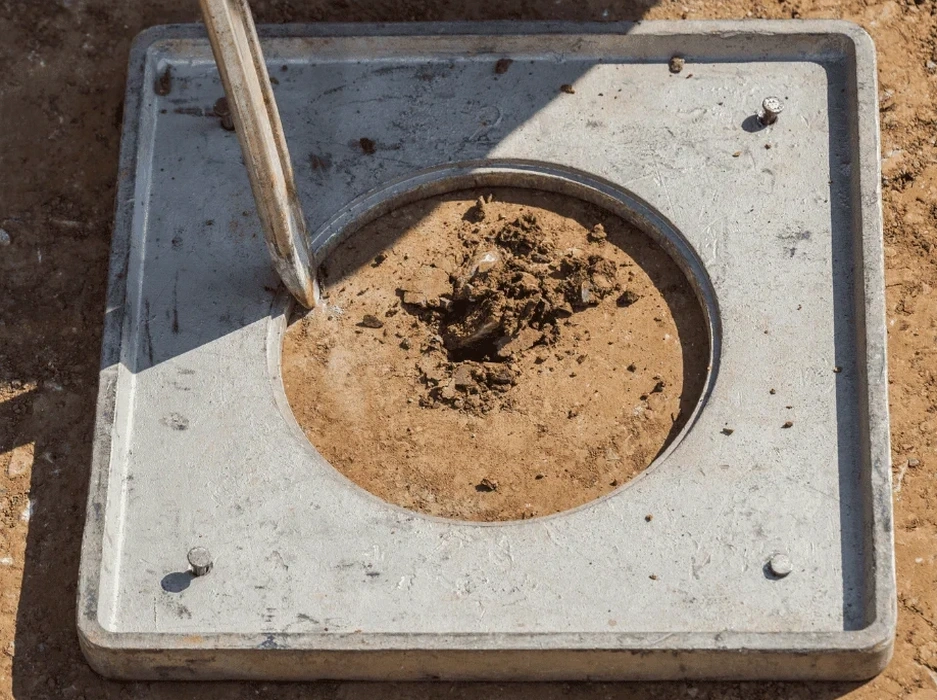
The hollow-stem auger rig pulls up sandy samples from a boring in the LA Basin, and the first thing we do in the lab is check the gradation and fines content. That initial look tells us whether the soil has the grain-size profile that Seed and Idriss flagged as most susceptible to pore-pressure buildup during a major seismic event. For a CPT test in the soft alluvium near the Los Angeles River, the cone resistance and sleeve friction give us a continuous profile of cyclic resistance ratio without disturbing the sample, which matters when you are dealing with silty sand lenses that can misbehave under the shaking levels expected from a Puente Hills blind thrust scenario. We run the numbers against the M7.8 design earthquake that the USGS ShakeOut scenario projects for this part of Southern California, because generic screening tables do not capture the basin-edge amplification that affects downtown and the corridor along the 110 freeway.
Liquefaction is not just about sand boils: in LA's interbedded basins, thin silt seams can trigger a lateral spread that displaces foundations even when the surface looks dry.
Local geotechnical context
The coastal fog belt from Santa Monica to Long Beach keeps near-surface moisture high through June, and that perched groundwater is a variable that catches off-guard developers who assume the water table is always 40 feet down. When a wet winter follows a drought cycle, the upper sands can become fully saturated just a few feet below the slab, and that is when a moderate M6.5 event on the Newport-Inglewood fault can generate excess pore pressure fast. The basin geometry itself amplifies shaking at periods around 1.0 to 1.5 seconds, so a 10-story structure on a mat foundation in the Mid-Wilshire district may see a different demand than a single-story tilt-up in the same zip code. We factor in the site amplification coefficients from ASCE 7-22 Chapter 11 and run the post-liquefaction settlement analysis because differential movement between adjacent footings is often the real failure mode, not the dramatic bearing loss that people imagine.
Common questions
How much does a soil liquefaction analysis cost for a typical single-family lot in Los Angeles?
For a standard residential lot in the LA area, the field investigation plus the lab package and the signed report typically runs between US$2,420 and US$4,240. The spread depends on the number of borings, the depth required, and whether we use SPT only or need to add CPT soundings. Sites with difficult access, like hillside lots in Echo Park or Mount Washington, may require a smaller track rig, which affects the mobilization cost.
Does the City of Los Angeles Department of Building and Safety require a liquefaction study for every project?
LADBS requires a liquefaction assessment when the project falls within a designated liquefaction hazard zone on the State of California Seismic Hazard Zone map, or when the geotechnical investigation identifies saturated loose sandy soils in the upper 50 feet. Even outside mapped zones, the building official may request the analysis under IBC 2024 if the site class is E or F and the design PGA exceeds 0.40g, which covers much of the LA Basin.
What is the difference between the SPT-based and the CPT-based liquefaction analysis?
The SPT-based method uses the corrected blow count (N1)60cs and works well in sands with some fines, and it has the advantage of giving us a physical sample to run grain-size and plasticity tests. The CPT-based method gives a continuous profile of tip resistance and sleeve friction, so it catches thin liquefiable seams that the SPT might miss because the split spoon only samples every 2.5 or 5 feet. In LA, we often run both when the stratigraphy is complex—SPT for the sample and index tests, CPT for the high-resolution resistance profile and pore-pressure dissipation data.
How long does the liquefaction analysis take from drilling to the final report?
For a standard project with two borings, we typically have the drill rig on site for one day, and the lab testing is completed within 5 to 7 business days after we receive the samples. The analysis and report drafting take another 5 to 7 business days, so the full turnaround is usually between two and three weeks. During the busy summer construction season in LA, we may need to schedule the rig a week or two in advance, but the lab and analysis timeline stays consistent.